Summer is in full swing and Winter Garden is RED HOT. Year after year the zip code that Ron the Realtor has been focusing on for last 19 years continues to outperform the rest of Central Florida.
2017 so far is no different… 34787 is experiencing record-setting growth, there are more new communities for buyers to call home than there has ever been in the area. Luckily the competition is keeping the prices in check, well within reason. The builders are all offering incentives and of course, the smart buyers that are calling Ron the Realtor to represent them are seeing far BIGGER incentive packages than any other buyer. The deals Ron is negotiating are unreal, Ron has relationships with all the builders and is selling more homes in the area than ANYONE in America… this brings with it volume discount mentality for Ron’s clients, even if they are only buying one home.
To buy a home in Winter Garden and not call Ron the Realtor would be foolish.
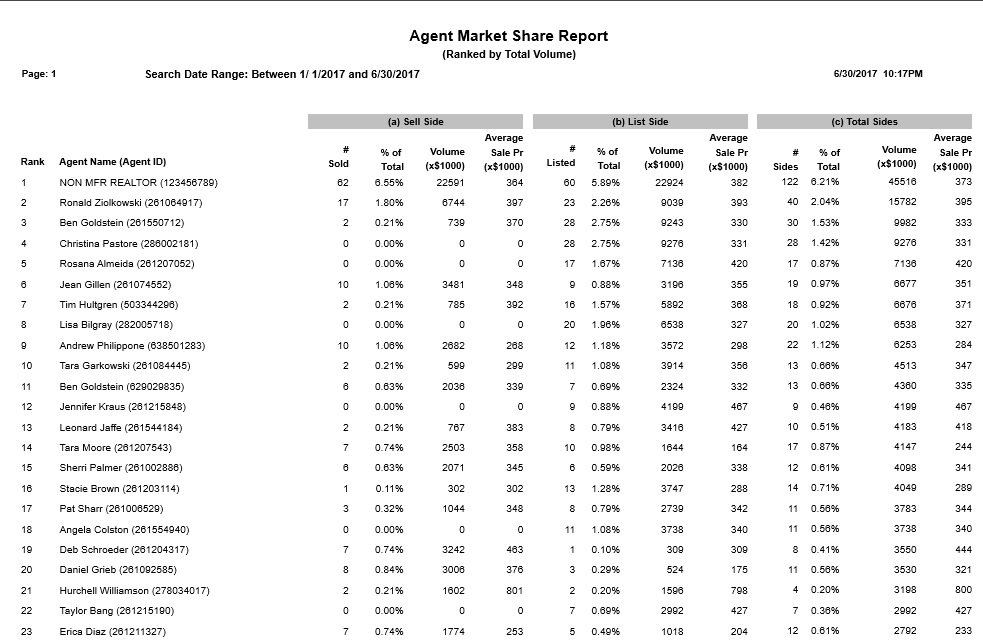
RON THE REALTOR has sold 40 homes in Winter Garden so far in 2017… that is almost and unheard of 1.5 a week average !
As you can see Ron is yet again Dominating the Winter Garden market year to date in 2017… Even crushing the largest national home builder LENNAR HOMES (Ben Goldstein is the broker of record on mls).
Below contains information you will not find anywhere on the internet in one place, let alone broken down to this level. Knowledge is power and RTR’s clients are armed with the most up to date and accurate data to make solid informed choices with confidence. Having Ron in your corner to help sort this all out, negotiate amazing contracts and ensure a smooth drama free closing is truly the RTR difference you as his client get to benefit from.
Enough boasting, let’s get to why you spent time opening this report…
2nd quarter was the best numbers since the boom of 2016 in volume, average sold price, Median price, and $/ft.
Here is every unit sold and closed on the ORRA MLS for the 2nd quarter of 2017 for zip code 34787 Winter Garden, Fl
2017 2nd qtr
| Status: Sold (492) | |||||||||||||
| Beds | Baths | SqFt Heated | List Price | LP/SqFt | Close Price | SP/SqFt | DTC | DTCL | ADOM | CDOM | SP/LP Ratio | ||
| Min | 1 | 1 | 420 | $64,000 | $55.92 | $56,000 | $64.20 | -222 | -29 | .8 | |||
| Max | 7 | 8 | 5,752 | $1,425,000 | $1,188.90 | $1,400,000 | $1,188.90 | 407 | 533 | 407 | 432 | 1.29 | |
| Avg | 4 | 3 | 2,545 | $355,634 | $140.89 | $348,133 | $138.01 | 55 | 102 | 55 | 62 | .98 | |
| Median | 4 | 3 | 2,415 | $320,537 | $133.96 | $317,000 | $132.32 | 22 | 75 | 22 | 25 | .98 | |
Compare it to 1st quarter of total solds in Winter Garden in 2017
If you run the math, which you do not have to, Ron has done it for you… you will see an interesting development… and this is where reading this report will make you dangerous in any water cooler circle of discussion regarding real estate, even with another Realtor in that circle …
If you look at it at face value you will see an almost flat Average closed sale price from $349,593 in the 1st quarter to $348,1333 in the second quarter… in fact, many untrained eyes and hack journalists will run to their keyboards and say the market is finally contracting.. the sky is falling…..
But if you look at all the data you will see several indicators that would make them look foolish, these indicators are what Ron uses to identify the future trends…
While price contracted under .25% the market went up… and went up big time…
How do you ask? $/ft is the more accurate indicator and look at what the $/ft did in the same timeframe. It shot up 5% in one-quarter!
The units sold shot up 54% and average days on the market improved a whopping 12 days… that’s almost 2 weeks!
keep in mind that many of the actual closed sales in this zip code are not even recorded on ORRA MLS , they are brand new builder sales. These sales are achieving even higher sale price and $/ft numbers. * Also, the unbuilt inventory that is listed in this zip code on the mls tends to take 4 months or so to go pending, when the roof and dry in occurs, so that is also drastically skewing the days on market.
These are all factors most will not put into the equation,…. these are real life factors that many of the “elite media” would not even identify… kind of like they are still shocked that TRUMP is our president…lol
Here are the 1st quarter numbers for comparison…
1st quarter 2017
| Status: Sold (320) | |||||||||||||
| Beds | Baths | SqFt Heated | List Price | LP/SqFt | Close Price | SP/SqFt | DTC | DTCL | ADOM | CDOM | SP/LP Ratio | ||
| Min | 1 | 1 | 580 | $45,900 | $24.80 | $55,000 | $52.40 | -255 | -25 | .76 | |||
| Max | 7 | 11 | 5,834 | $1,199,900 | $346.53 | $1,133,000 | $325.69 | 529 | 572 | 529 | 541 | 2.11 | |
| Avg | 4 | 3 | 2,695 | $358,566 | $134.78 | $349,593 | $131.40 | 69 | 117 | 67 | 76 | .98 | |
| Median | 4 | 3 | 2,538 | $327,020 | $130.15 | $324,703 | $127.41 | 41 | 94 | 37 | 42 | .99 | |
In the spirit of instant gratification, here is all of 2016 for 34787 Winter Garden, Florida…
when you break down the below chart and compare it with the 1st chart, the 2nd quarter of 2017…
You will see 7.25% increase in $/ft, keep in mind this is all of 2016… Jan- Dec. with only a 1% in average closed sale price increase
16
2016 sales
| Status: Sold (1332) | |||||||||||||
| Beds | Baths | SqFt Heated | List Price | LP/SqFt | Close Price | SP/SqFt | DTC | DTCL | ADOM | CDOM | SP/LP Ratio | ||
| Min | 2 | 1 | 227 | $15,000 | $11.40 | $18,501 | $14.06 | -273 | -132 | .71 | |||
| Max | 8 | 10 | 7,573 | $2,490,000 | $1,383.22 | $2,050,000 | $1,374.41 | 1,326 | 1,023 | 1,325 | 1,412 | 1.57 | |
| Avg | 4 | 3 | 2,701 | $353,761 | $132.00 | $344,418 | $128.67 | 70 | 120 | 71 | 80 | .98 | |
| Median | 4 | 3 | 2,596 | $323,162 | $127.78 | $319,000 | $124.73 | 36 | 91 | 37 | 41 | .98 | |
Again, in the spirit of instant gratification and even more importantly in the spirit of the quest for knowledge… here is ONLY the second quarter of 2016…
when you cut out just the 2nd quarter and do a year to year breakdown… you will see…. major improvements
2nd quarter ONLY 2016 you will see an astounding 9% jump in $/ft… a 5% JUMP in average sale price and 9 days off average days on market…
-
this is very important when you compare one-quarter versus the entire last year, it really skews the raw data… when you take same time of each 12 month period, you really get the more accurate picture… and as you can see Winter Garden has exploded yet again…
| Status: Sold (421) | |||||||||||||
| Beds | Baths | SqFt Heated | List Price | LP/SqFt | Close Price | SP/SqFt | DTC | DTCL | ADOM | CDOM | SP/LP Ratio | ||
| Min | 1 | 1 | 572 | $30,000 | $22.42 | $30,000 | $27.17 | -273 | -11 | .71 | |||
| Max | 8 | 10 | 7,573 | $2,490,000 | $383.43 | $2,050,000 | $356.56 | 1,326 | 989 | 1,325 | 1,325 | 1.57 | |
| Avg | 4 | 3 | 2,608 | $343,235 | $130.35 | $332,239 | $126.53 | 75 | 125 | 76 | 85 | .97 | |
| Median | 4 | 3 | 2,478 | $312,800 | $126.02 | $305,000 | $122.65 | 39 | 90 | 39 | 43 | .98 | |
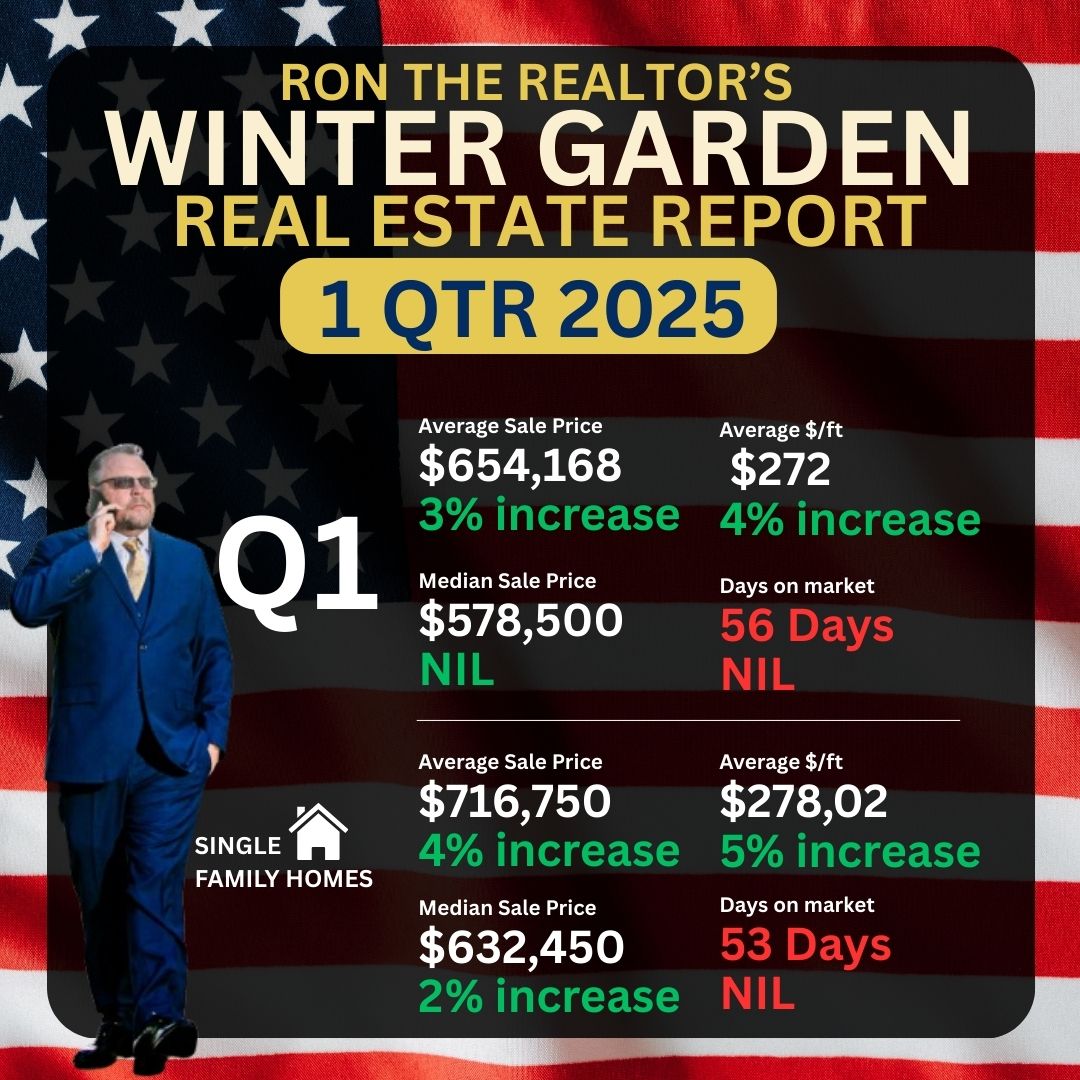
FINALLY, no RTR quarterly report would be complete without analyzing the single family home market on it’s own merit… below is the 2nd quarter data on single family homes only… of course the numbers are all higher except days on market, condos and townhomes are lower priced and sell faster in any market.
Winter Garden had the highest closed sale so far of 2017 in the second quarter… on the shores of Lake Hancock
7592 John Hancock Rd sold for 1.4m
2nd qtr single family homes only
| Status: Sold (402) | |||||||||||||
| Beds | Baths | SqFt Heated | List Price | LP/SqFt | Close Price | SP/SqFt | DTC | DTCL | ADOM | CDOM | SP/LP Ratio | ||
| Min | 2 | 1 | 429 | $69,900 | $55.92 | $56,000 | $64.20 | -222 | -29 | .8 | |||
| Max | 7 | 8 | 5,752 | $1,425,000 | $1,188.90 | $1,400,000 | $1,188.90 | 407 | 533 | 407 | 432 | 1.29 | |
| Avg | 4 | 3 | 2,759 | $388,490 | $143.34 | $380,175 | $140.39 | 58 | 105 | 58 | 66 | .98 | |
| Median | 4 | 3 | 2,618 | $349,995 | $135.74 | $344,906 | $133.50 | 23 | 77 | 24 | 28 | .99 | |
Summary
Winter garden has jumped 5% in average sold price and 9% in $/ft closed sale prices from 2nd quarter 2016 to 2nd quarter 2017. Days on market were cut by 9 days.
Ron the Realtor has yet again dominated the entire zip code, even crushing the largest national home builder LENNAR….
and finally
There is only one choice for representation when it comes time to buy or sell when you want to exceed your real estate goals you call
Ron the Realtor
no such thing as after hours.