4th Quarter 2018 Summary
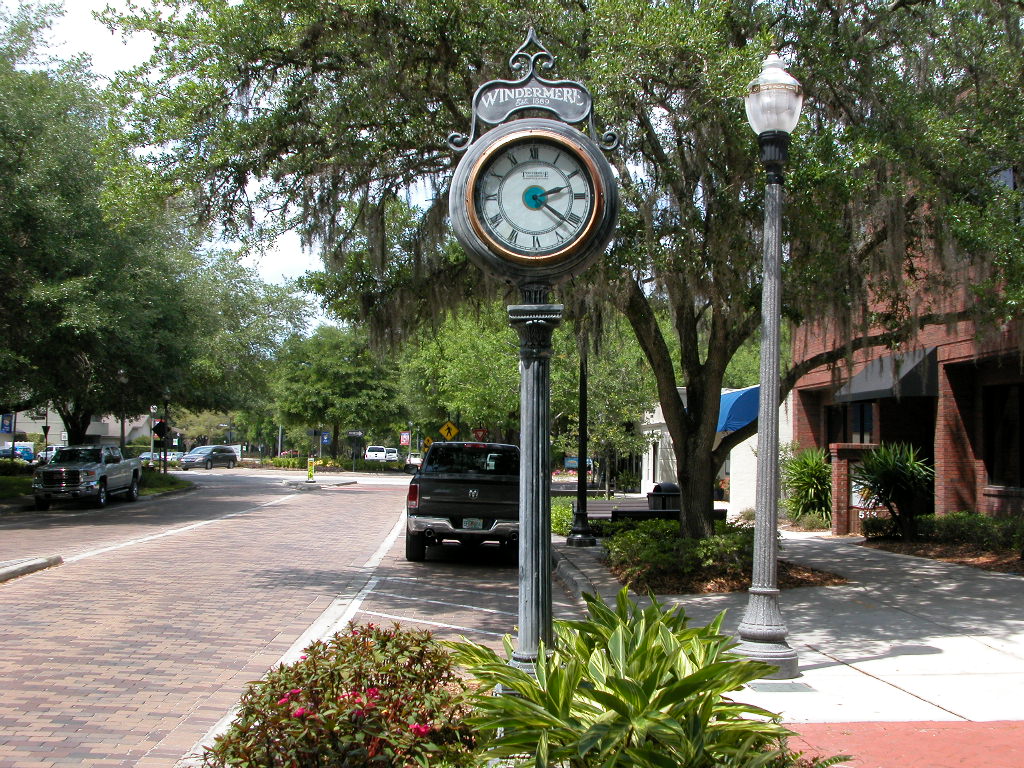
Windermere Market Report
Welcome to the only place on the web that breaks down Windermere Florida 34786 real estate market to this level each and every quarter for well over the past decade. All the data here is derived from the ORRA MLS and deemed reliable. It has been analyzed by longtime Windermere resident Ron the Realtor. Ron is the #1 Remax Realtor in the entire State of Florida and is currently number 3 in closed volume year to date for Orange County in the entire MLS.
635,176
77
182.27
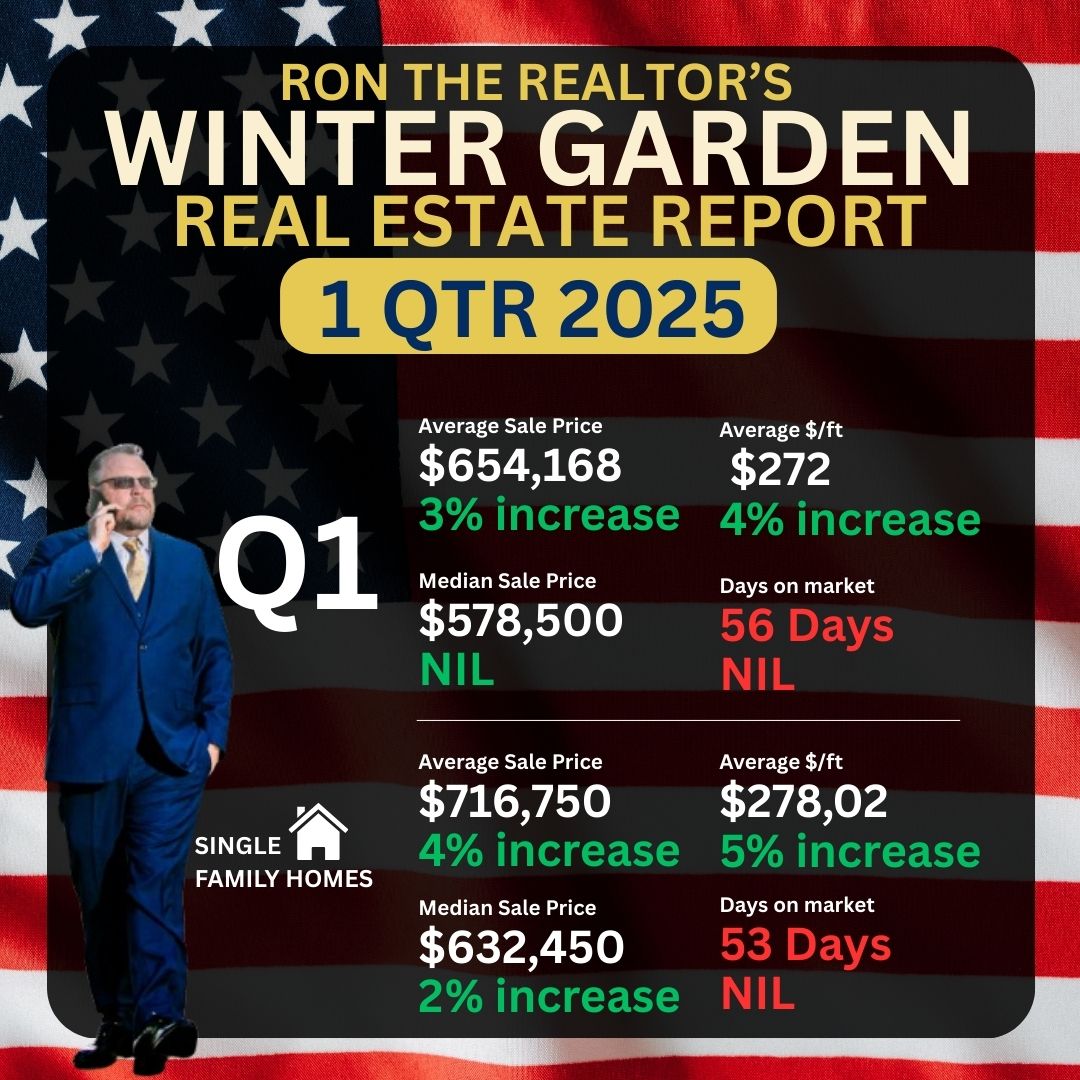
Here is a side by side comparison of the 2017 and 2018 Windermere real estate markets 4th quarters in all the important and relevant categories.
2018 4th quarter units sold in Windermere 34786
2017 4th quarter units sold in Windermere 34786
In 2018 the average sale price jumped 5% in average closed sale price from 2017 4th quarter. This actually outpaced the 2nd quarter 2018 jump of 3% and 3rd quarters 4.8% jumps. What sticks out, even more, is the massive improvement in median sale price and days on the market. Signaling that properties in Windermere are in very high demand and are selling over a week earlier from 2017 4th quarter. You will notice from the charts that the lowest sale in 2017 4th quarter was just under 175k... in 2018 that value jumped to just over 200k.
5
9
4
Let's break it down in true Ron the Realtor style, down to only single-family homes. Removing townhomes and condos from the equation.
2018 4th quarter single-family homes sold in Windermere 34786
4th Qtr 2017 Windermere 34786
4th Qtr 2018 Windermere 34786
When dealing only with the single-family homes the prices truly jump, 100k in fact. The average sale price increased just over 20k with a 3% jump, but stood out was $/ft had minimal improvement. The reason was the average size of the home sold in 2018 4th quarter was over 100 sq ft larger than in 2017. You want to know stood out even more? The average days on market improve an entire 2 weeks from 2017 and the median sale price jumped 8.5%. This shows how much demand there is in the Windermere area. I have never seen such an improvement in days on market in a quarter.
The EXACT amount of homes closed in the 4th quarter of 2017 and 2018… weird.
3
16
0
SUMMARY
Windermere’s real estate market is one of the healthiest and robust in the entire state.
Windermere is always in high demand, the Butler Chain of Lakes, Downtown area with no HOA and all the gated communities are what higher end buyers always look for. The renovating of the older dated homes is evident on many streets with dumpsters in the driveway. This only further helps the future values as many of the dated homes which are selling low today will be back on at significantly higher prices in the future.
Windermere has been losing many 400-600k buyers to the neighbor to the west Winter Garden, which anyone who reads these reports ..knows is red hot with construction and demand. The one thing that Winter Garden new construction cannot deliver is gated communities, oversized lots and the mature landscaping of the established neighborhoods. For the discerning buyer, Windermere is where they choose to call home for these reasons.
The 4th quarter benefited from 7 homes closed over 2 million and 2 of those closed over 5m, two over 10,000 sq ft estates behind the manned gates of Isleworth. 9 more sold over 1.5m showing that the 4th quarter was swimming in high-end buyers and sales. This is what drove the median sale price up as well as the average sq ft of the homes sold.
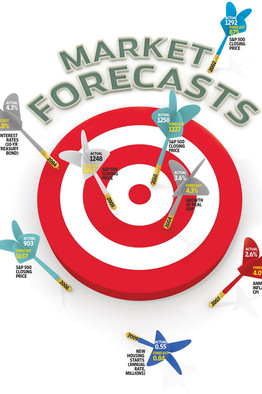
Looking forward to running the numbers on the Windermere year in review to see how much Windermere jumped but after doing the 4 quarterly reports, every category improved in every quarter from the previous year.
What needs to be highlighted about the Windermere reports is that they are more accurately reflecting the TRUE market within these data tables. If you read the Winter Garden reports I also publish, you will have read that almost 50% of the sales are not even being reflected in these tables. The reason is the historical development Winter Garden is experiencing today. There are swaths of sales of new home construction not reflected on the local MLS. In Windermere, with the exception of a handful of new home communities, the market is all resales. These numbers are very true to the real estate market in the real world.
I was expecting a pull back on the higher end market with the tax law cutting mortgage deductions down to a $750,000 ceiling from 1m. Diving deeper into the 4th quarter sales I noticed the top 8 closings (all above 2m) were all 100% cash. This could explain the drop in list price to sold price % from 97 to 96% in 2018 4th quarter.
Looking forward to seeing how the entire year shakes out. Thank you for reading this and all my reports. Make sure you read the 2018 year in review and RTRs 2019 predictions.
God Bless our troops overseas and the families they leave behind. I for one will never forget that FREEDOM IS NEVER FREE. My family thanks you for your sacrifice