3rd Quarter 2018 Summary
Windermere Market Report
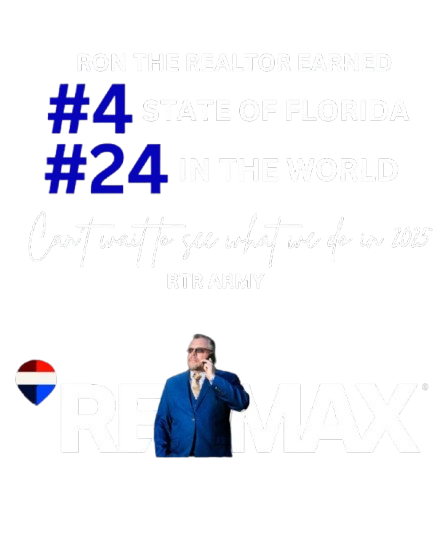
Welcome to the only place on the web that breaks down Windermere Florida 34786 real estate market to this elvel each and every quarter for well over the past decade. All the data here is derived from the ORRA MLS and deemed reliable. It has been analyzed by long time Windermere resident Ron the Realtor. Ron is the #1 Remax Realtor in the entire State of Florida and is currently number 3 in closed volume year to date for Orange County in the entire MLS.
622,177
71
180.95
2nd to 3rd quarter
4.8% increase in Average Sale Price
3.7% increase $/ft ($152.08)
-7% Decrease on Average Days on Market
2017 to 2018
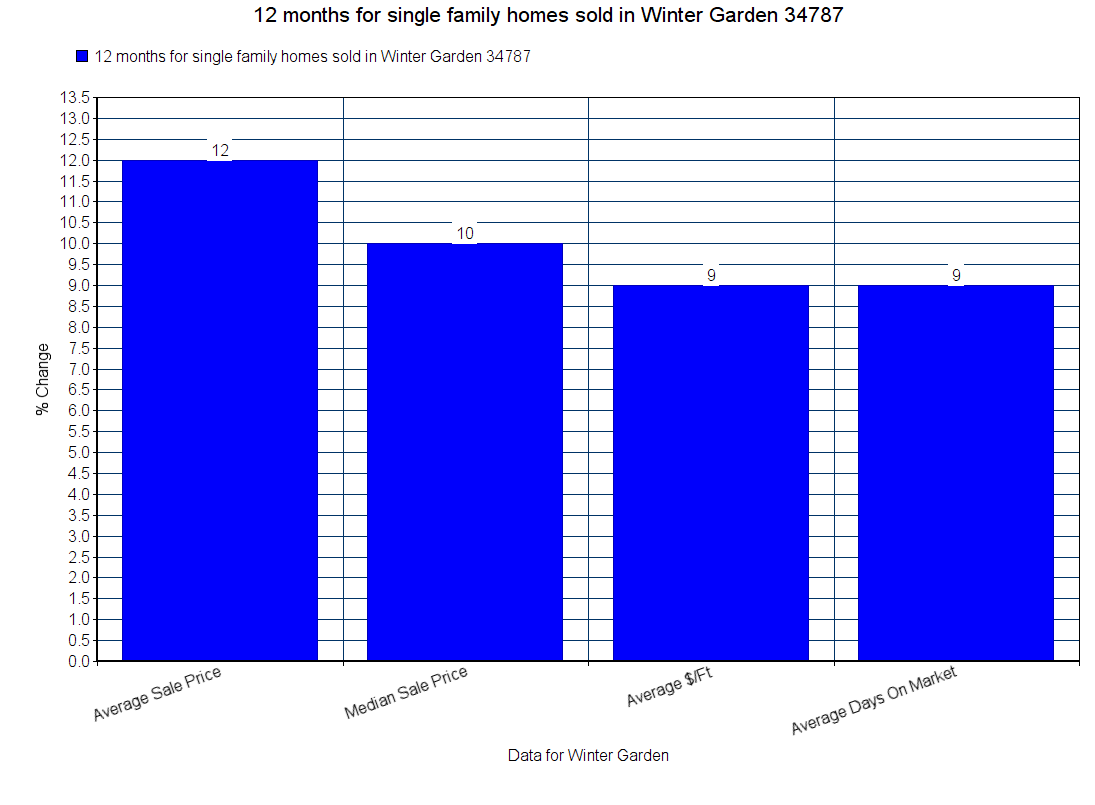
7.9 increase in Average Sale Price
4% increase $/ft
-8% Decrease on Average Days on Market
Here is the break down of the 3rd Quarter sales data
In the next 10 minutes, you will have more information and grasp of the Windermere real estate market than most full-time Realtors in the area. Well unless they read this market report, which many do… Like my idol Nikola Tesla, I give information and knowledge for free. The more everyone knows, the better the market becomes.
Let’s get on with it…
All Windermere from 2nd to 3rd quarter
2nd Quarter 2018 Windermere
3rd Quarter 2018 Windermere
379,779
52
152.08
All Windermere from 3rd QTR 2017 to 3rd QTR 2018
3rd Qtr 2017 Windermere 34786
3rd Quarter 2018 Windermere
In the 2nd quarter report, you will recall we saw a 3% jump in average and 17% jump in median closed prices from the first quarter… The 3rd quarter we experienced even further gains with an additional 4.8% jump from 2nd to 3rd quarter in average and DOUBLE DIGIT jump in median sale price for 2nd quarter in a row. We could not continue the massive improvement of days on market experienced 1st to 2nd qtr of 27% but we saw a 5-day improvement still. What else is worthy to note is a drop of total closed sales of over 20%, due to lack of inventory… not demand.
7.9 increase in Average Sale Price
4% increase $/ft
-8% Decrease on Average Days on Market
Windermere is consistently outpacing the local and national market trends.
As Ron always does, he takes it to another level… let’s pull out all the multifamily and just focus on all the single-family homes and dive into that data
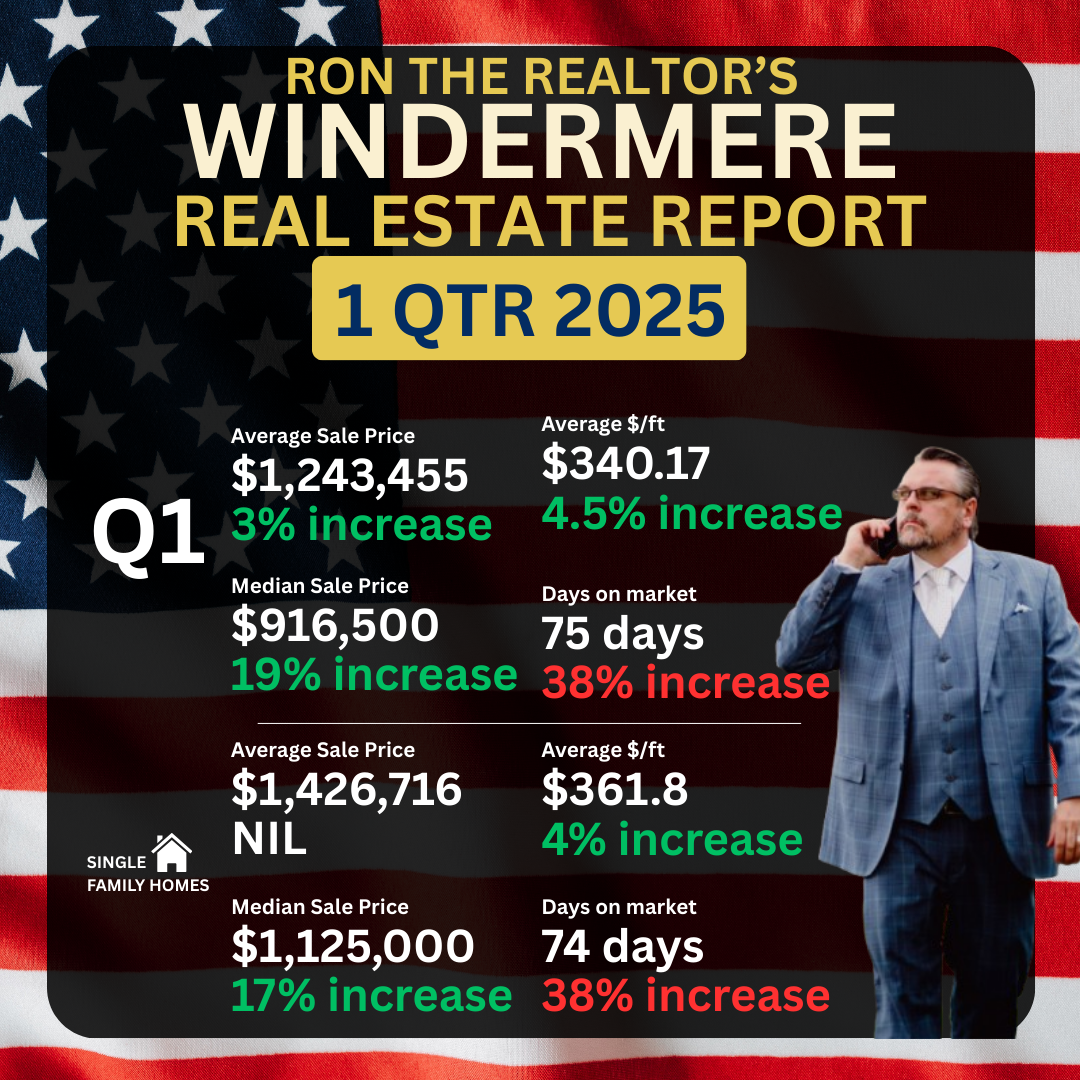
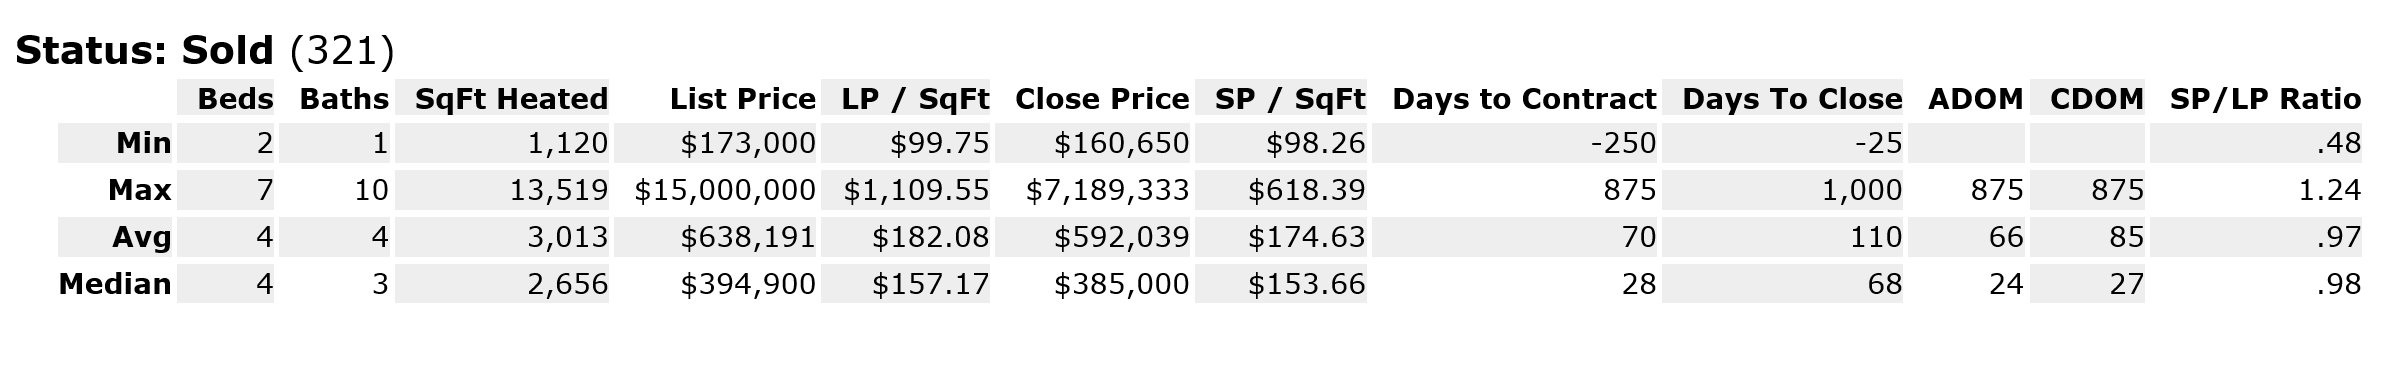
3rd Quarter 2018 Single-Family Homes only Windermere
2.3% Increase In Average Sale Price
7% Increase in Average Days on Market
3% increase $/ft
Lets compare 3rd qtr 2018 to 3rd Qtr 2017
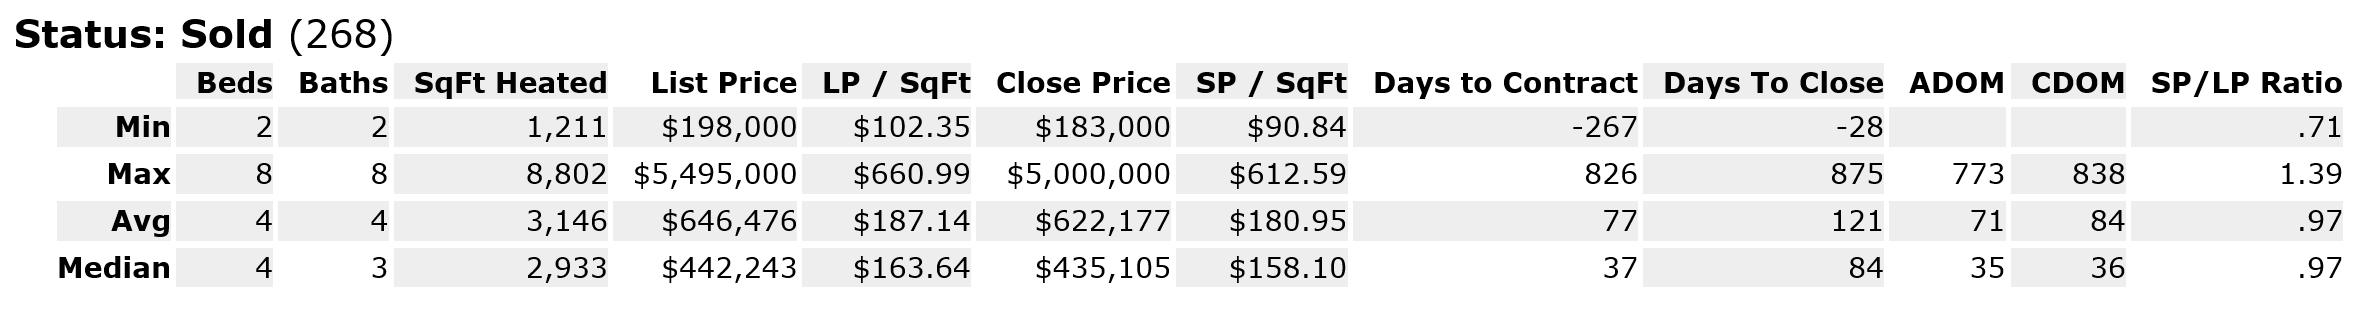
3rd Qtr 2017 Single Family only Windermere 34786
2.5% Increase In Average Sale Price
-8% Decrease in Average Days on Market
2.4% increase $/ft
MARKET SUMMARY
When you compare the 3rd quarters side by side, you see a massive uptick in closed sales in 2018, 61 more closed in fact! The average sale price only jumped 2.5% in the 12-month span and the median while still doubling the Orlando average, is more down to earth than the double digits we have experienced over last to quarter comparisons. What really sticks out is that the average days on market shortened by 8 whole days.
We really need to keep in mind that 3rd quarter of 2017 our local market was put to a screeching halt for several weeks when record hurricane Irma paid a visit. So I really have a little bit of an issue with taking the data at face value. You truly have to apply common sense and real-world understanding to these numbers. That is what separates an expert from the rest, in my opinion.
MARKET FORECAST
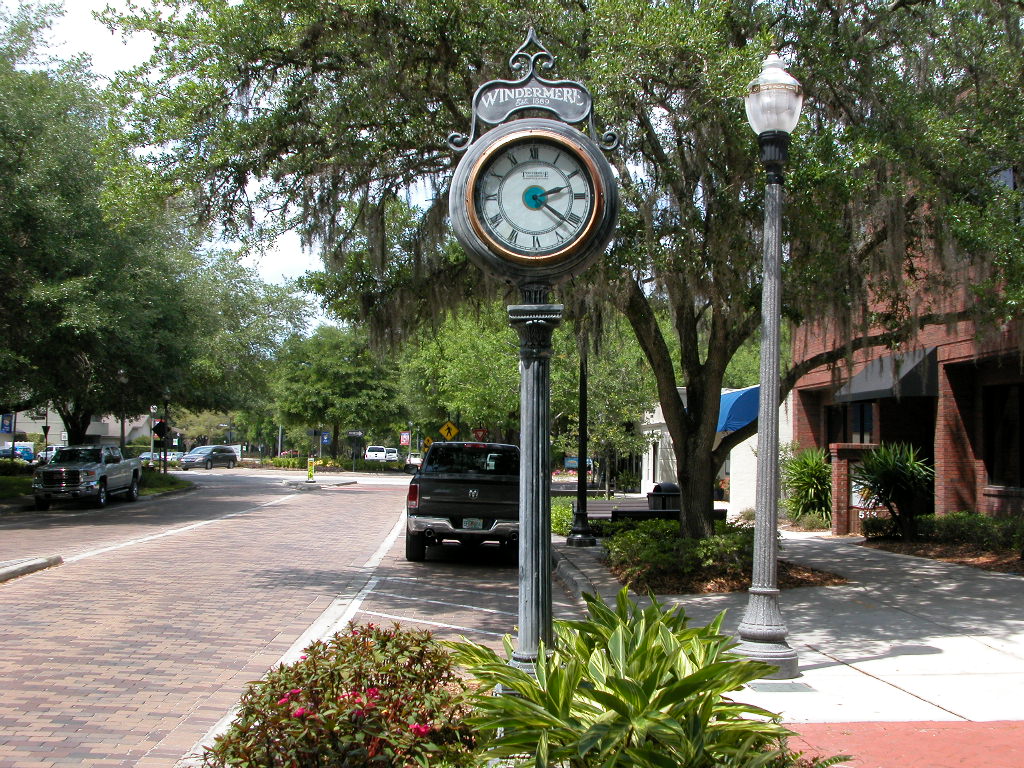
Windermere is always in high demand, the Butler Chain of Lakes, Downtown area with no HOA and all the gated communities are what higher end buyers always look for. The renovating of the older dated homes is evident on many streets with dumpsters in the driveway. This only further helps the future values as many of the dated homes which are selling low today will be back on at significantly higher prices in the future.
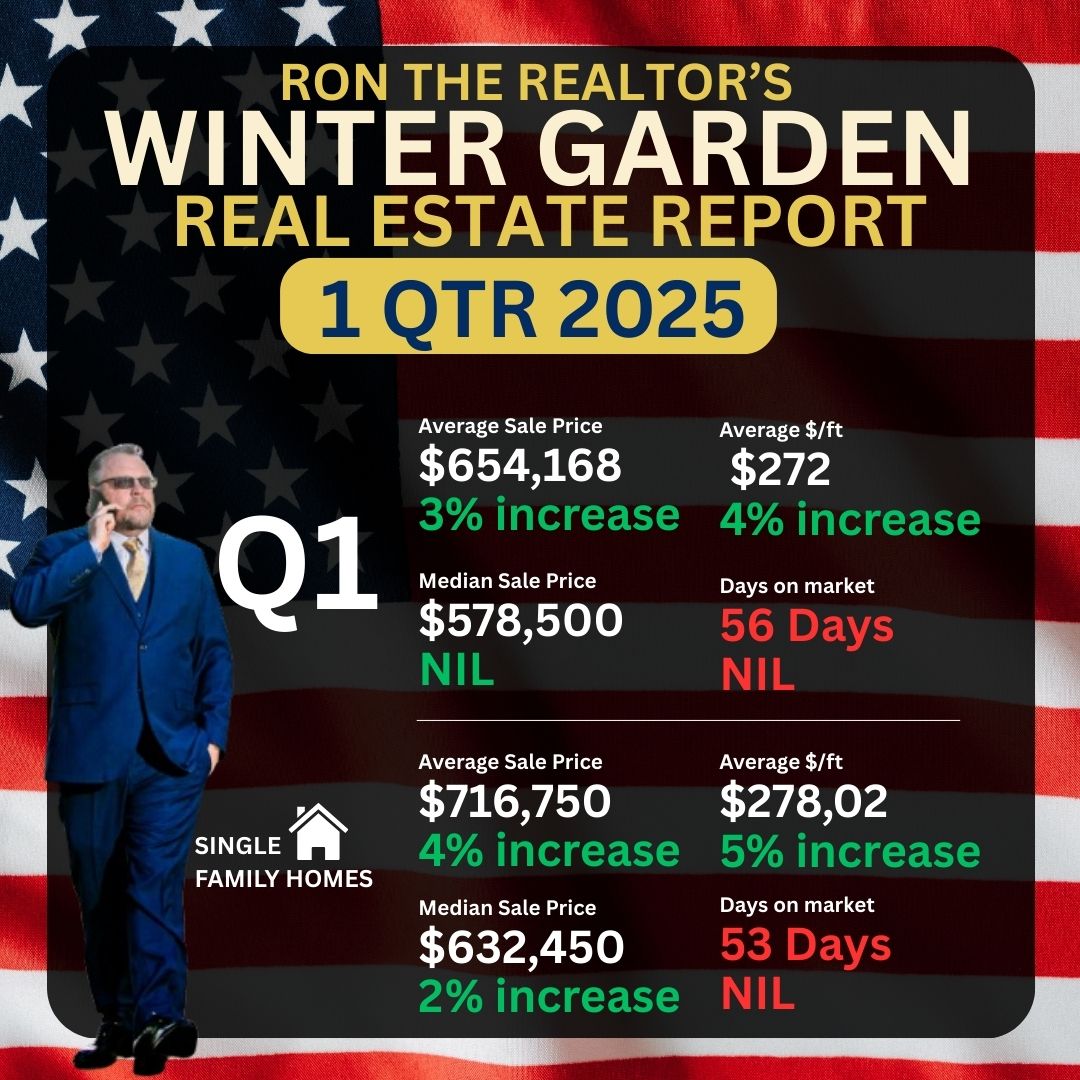
Windermere has been losing many 400-600k buyers to the neighbor to the west Winter Garden, which anyone who reads these reports ..knows is en Fuego with construction and demand. The one thing that Winter Garden new construction cannot deliver is gated communities, oversized lots and the mature landscaping of the established neighborhoods.

The jump in interest rates over the last 6 months has also impacted the luxury market in the area, Rates are hovering at 5% when a year ago they were at 4%ish. This is a big impact on the monthly payment, and in Windermere, the average single-family sale price has jumped to over $700,000!
RTR predicts the 4th quarter to slow down the pace of appreciation and recoil back a little of the last 2 quarters days on market improvement. The mid-term elections and the governor’s race are looming large this quarter. Will not be surprised if the sale of homes over the 2m market drop below 5 or even 4 in the 4th quarter. The 1st and 4th quarters are historically the slower of the two in this local real estate market. Not expecting anything different this year.
When we take the year as a whole I am expecting to see a 4-5% increase in average and much higher in median sale price improvement. Windermere will outpace the local market as a whole, this I am certain. As for what’s ahead in 2019, you will have to wait for the RTR year in review in 3 short months.
Bottom Line
Windermere is and has been a place to call home. Ron’s family does as well. If you are considering Windermere for your next move call and let’s discuss all the options in your price range. If looking to sell and cash out on this hot market, no one delivers higher sale prices and faster closing times than RTR… proven year after year.
My Phone is always on and no such thing as after hours.
407 592 SOLD
Thank you for taking the time to read my blog. If you have any specific questions or want to buy/sell … my phone and email are always the best way to reach me day or night.
Have a great day.