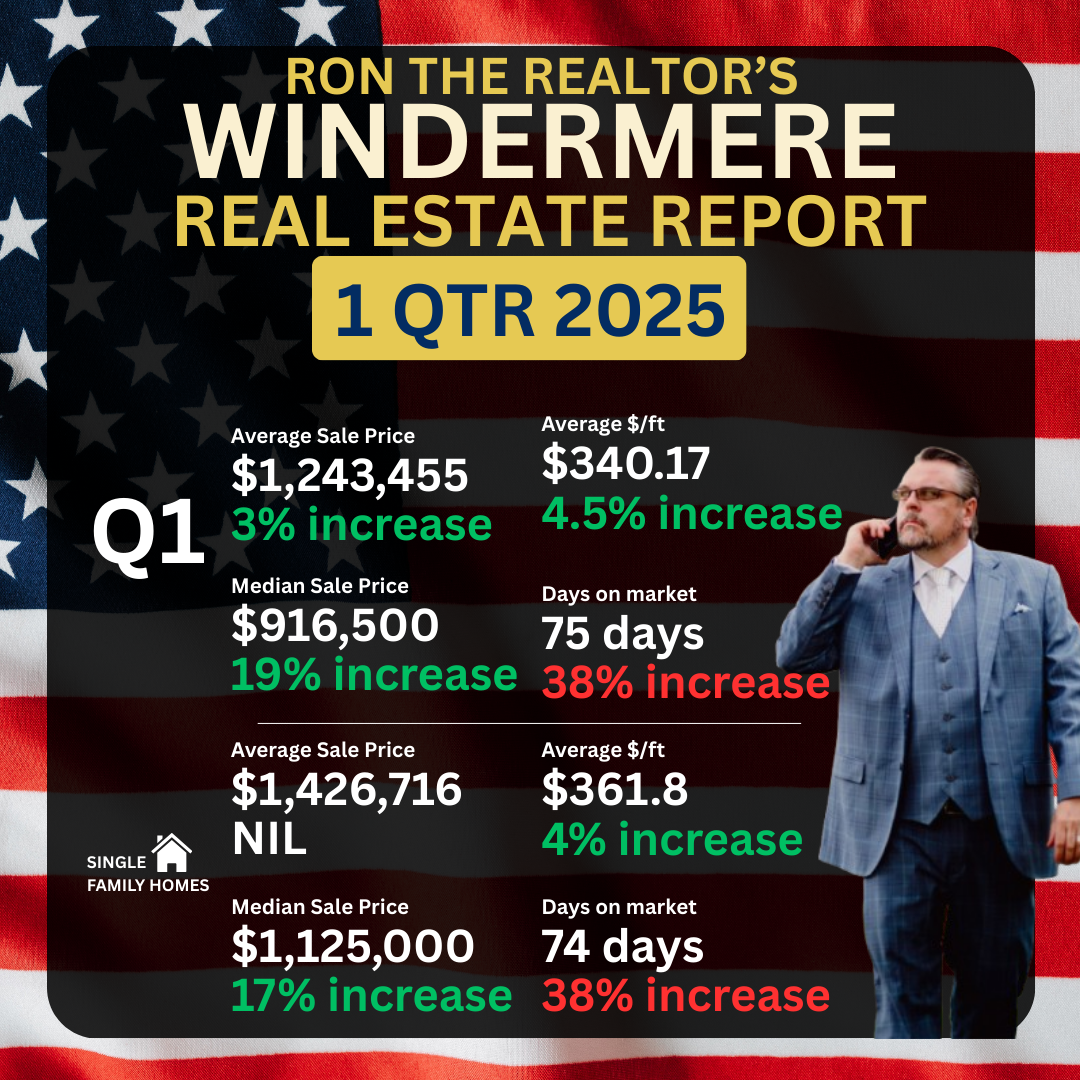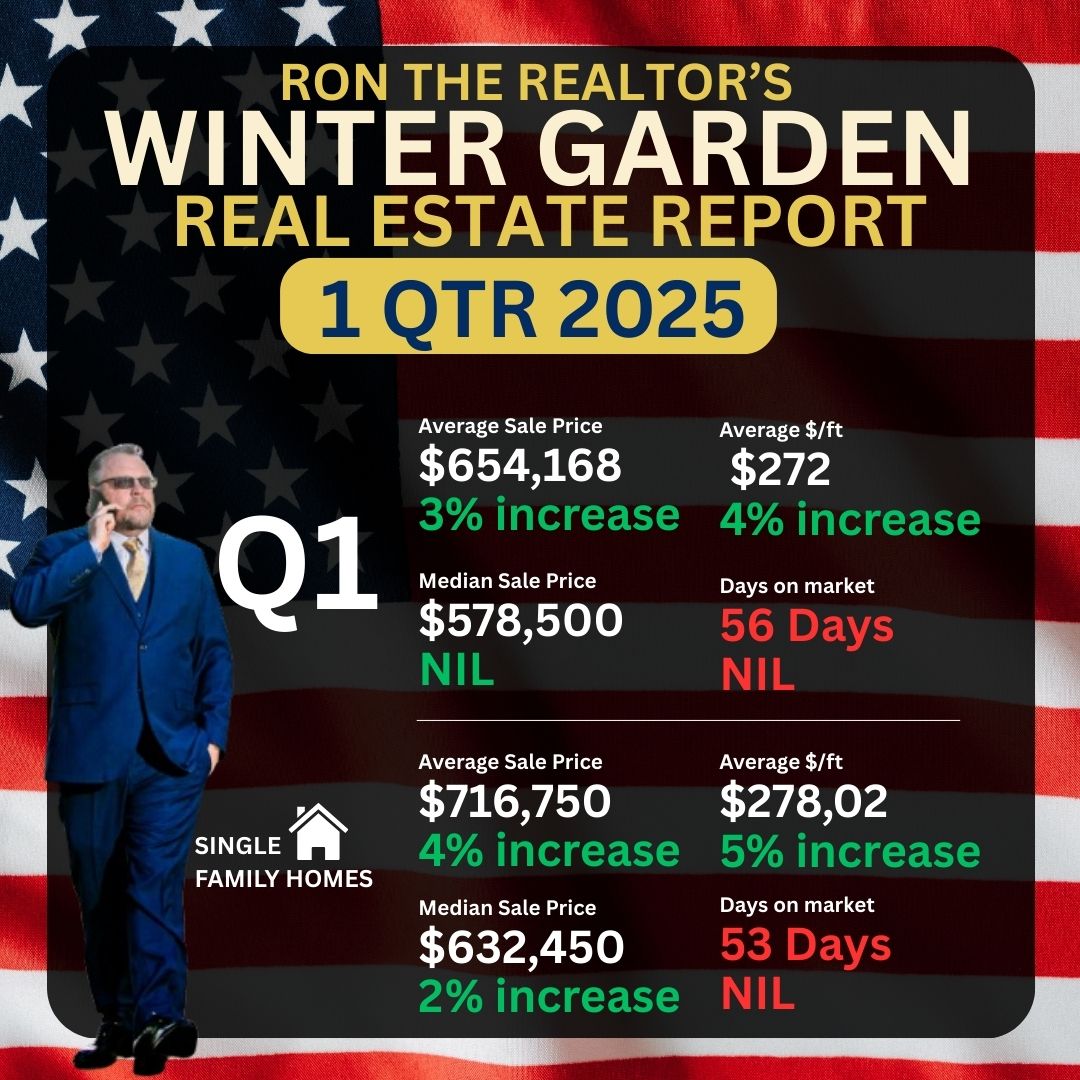
Thank you for taking a few minutes to get up to speed with the Windermere, 34786, market. This is the only place on the internet to get this type of breakdown of Windermere, FL 34786 and of course, Ron the Realtor’s personal in-depth knowledge of the area.
Windermere is where Ron calls home and has been dominating in sales for almost 20 years. Below are a series of Charts taken directly from the Orlando Realtor Association MFRMLS… and the data is deemed to be accurate. Information is on thing but interpreting the information to gain knowledge is another. That is what Ron provides his clients consistently, and why Ron and his investors beat the market every year.
This first chart is 2016 1st quarter, every unit sold in Windermere, FL 34786.
| Status: Sold (189) | |||||||||||||
| Beds | Baths | SqFt Heated | List Price | LP/SqFt | Close Price | SP/SqFt | DTC | DTCL | ADOM | CDOM | SP/LP Ratio | ||
| Min | 2 | 2 | 1,155 | $157,000 | $51.38 | $154,000 | $68.46 | -11 | .78 | ||||
| Max | 7 | 8 | 7,463 | $3,650,000 | $591.61 | $3,350,000 | $537.83 | 937 | 969 | 897 | 2,586 | 1.33 | |
| Avg | 4 | 4 | 3,203 | $576,136 | $164.99 | $550,054 | $158.10 | 109 | 159 | 104 | 134 | .96 | |
| Median | 4 | 3 | 2,987 | $395,000 | $143.53 | $385,000 | $137.99 | 63 | 118 | 57 | 68 | .97 | |
The average sale price of CLOSED sales was $550,000 with Av per sq ft of $158 and the average days on the market was 134 (CDOM is the true and accurate field for days on market .. ADOM is average days on market and is easily corrupted, CDOM is continuous, start to finish regardless if seller changed Realtor during sale process)
Following Chart is 2017 1st quarter for Windermere, Fl 34786
| Status: Sold (247) | |||||||||||||
| Beds | Baths | SqFt Heated | List Price | LP/SqFt | Close Price | SP/SqFt | DTC | DTCL | ADOM | CDOM | SP/LP Ratio | ||
| Min | 2 | 2 | 1,155 | $179,900 | $94.76 | $167,500 | $59.40 | .63 | |||||
| Max | 8 | 10 | 15,332 | $6,500,000 | $602.89 | $5,600,000 | $602.89 | 654 | 687 | 622 | 622 | 1.06 | |
| Avg | 4 | 4 | 3,208 | $649,781 | $179.08 | $615,142 | $171.56 | 106 | 154 | 100 | 120 | .96 | |
| Median | 4 | 3 | 2,774 | $399,900 | $150.86 | $384,990 | $146.67 | 76 | 132 | 71 | 84 | .97 | |
You can see the amazing SPIKE in average sale price, which is over 10% jump quarter to quarter… also the $13 per foot jump as well, what also is impressive is the CDOM dropped a FULL 2 weeks, which is very significant.
This all points to an area high in demand, low in inventory, which is a recipe for a strong SELLERS MARKET.
Let us take it one step further, which Ron always does…
take out all the multi-family condos and townhomes and lets deal only with single family homes…Everything increases across the board obviously, especially in a prestigious town like Windermere , the highest sale of the 1st quarter last year was over 3 Million !
| Status: Sold (156) | |||||||||||||
| Beds | Baths | SqFt Heated | List Price | LP/SqFt | Close Price | SP/SqFt | DTC | DTCL | ADOM | CDOM | SP/LP Ratio | ||
| Min | 3 | 2 | 1,492 | $239,000 | $51.38 | $239,000 | $68.46 | -11 | .78 | ||||
| Max | 7 | 8 | 7,463 | $3,650,000 | $591.61 | $3,350,000 | $537.83 | 937 | 969 | 897 | 2,586 | 1.33 | |
| Avg | 4 | 4 | 3,556 | $653,840 | $171.03 | $623,341 | $163.39 | 121 | 172 | 117 | 150 | .96 | |
| Median | 4 | 4 | 3,225 | $462,000 | $148.32 | $449,500 | $143.30 | 79 | 133 | 69 | 83 | .97 | |
Let’s compare it directly with the 2nd quarter of 2017, just single family homes sold in Windermere, Fl 34786
| Status: Sold (197) | |||||||||||||
| Beds | Baths | SqFt Heated | List Price | LP/SqFt | Close Price | SP/SqFt | DTC | DTCL | ADOM | CDOM | SP/LP Ratio | ||
| Min | 3 | 2 | 1,536 | $259,000 | $94.76 | $235,000 | $59.40 | 1 | .63 | ||||
| Max | 8 | 10 | 15,332 | $6,500,000 | $602.89 | $5,600,000 | $602.89 | 654 | 687 | 622 | 622 | 1.06 | |
| Avg | 4 | 4 | 3,617 | $756,384 | $187.82 | $714,507 | $179.37 | 117 | 164 | 110 | 134 | .96 | |
| Median | 4 | 4 | 3,150 | $465,000 | $156.50 | $450,000 | $152.98 | 81 | 142 | 74 | 91 | .97 | |
You can see a massive SPIKE in average sale price, $/ft and 16 days off the CDOM… that saves a seller 2 weeks of carrying costs to their bottom line!
Also, a 5.6 Million dollar closing does not hurt your calculations….
Summary… Windermere is red hot and seeing a massive uptick in price, demand and a shortage of available inventory coming into the summer buying season.
Unlike its brother to the west, Winter Garden, Windermere lacks new housing options. With only a handful of new housing communities, the Windermere Buyer is choosing from one of a kind re sale inventory and is at the mercy of when that perfect home comes available.
This is driving up prices as pent-up demand is causing buyers to react quickly on new listings… with sellers that are priced correctly, experiencing multiple offers within 24-48 hours of putting a for sale sign on the front lawn.
There has not been a better time to sell your home in Windermere since 2006 than right now this spring. Call Ron today to find out what he can sell your home for! I think you will be pleasantly surprised.
** Ron is currently ranked number 10 in the entire MLS for closed sales volume in 2017 for Orange County.