Summer is in full swing and the market is literally red hot !
Take 15 minutes and become the most knowledgeable person in any circle of discussion revolving real estate. Knowledge is always power.
This is the only pace on the internet to get this much accurate and current real estate information in one publication.
JUST THE FACTS
Median Sales Price $181,900 up 10% from 5/14 !!!
Year to year median has increased now for 46 STRAIGHT months !!
57% higher today than 7/11 $115,000 median sale price
(If we could turn back time !!!)
2,951 closed sales in May, up almost 10% for 5/14
7,016 pending sales, with short sales only making up 22%, far cry from several years ago
11,798 Homes for sale on mls as of end of May
Average Interest rate 3.92 %
3.77 month supply at current pace
Average days on Market 72
National Market Update
Median Sales Price $228,700 7.9% higher than 5/14
*39 consecutive months of yr to yr increase
2.29 Million existing homes for sale
5.35 Million sold thus far in 2015
24% of all transactions were ALL CASH
5.1 month supply
Average interest rate 3.84%
US economic Outlook for May 2015
Presentation of New Home Construction Outlook
FORECLOSURE NEWS
Brian Honea from DS NEWS wrote such an on point and data fueled article regarding the national foreclosure/ REO market conditions I am going to copy and paste his entire article here along with a link to his actual page, great job Mr Honea…
May saw month-over-month increases in foreclosure starts, non-current residential housing inventory, and mortgage delinquencies, according to Black Knight Financial Services‘ First Look at Mortgage Data for May 2015 released Wednesday.
Non-current inventory, which is comprised of all residential properties 30 days or more delinquent or in foreclosure, totaled approximately 3.3 million in May – an increase of about 89,000 from April, according to Black Knight. It was the second consecutive month-over-month increase for non-current inventory; despite this, May’s total was down by more than half a million (537,000 loans) from May 2014. The state with the largest six-month improvement in non-current inventory was Florida, which had a non-current inventory of 8.31 percent in May – a 22 percent improvement from six months earlier.
The delinquency rate, which is the percentage of properties 30 days or more overdue but not in foreclosure, represented 4.96 percent of all residential mortgage loans nationwide in May – a 4 percent increase from April. May marked the second consecutive month-over-month increase in delinquency rate.
Overall, the number of delinquent mortgages jumped by 98,000 up to about 2.5 million in May. Despite the increase in delinquent loans for the last two months, the delinquency rate is still down by 12 percent from May 2014 and is at its lowest point since the summer of 2007, according to Black Knight.
Foreclosure starts climbed by 11 percent nationwide from April to May, from 73,500 up to 81,900, just one month after declining by nearly 22 percent from March to April.
The foreclosure pre-sale inventory rate ticked slightly downward month-over-month by about 10,000 properties to 754,000 in May, representing 1.49 percent of all mortgages nationwide. May’s foreclosure inventory total represented a decline of about 212,000 properties (22 percent) from May 2014, according to Black Knight.
FULL ARTICLE LINK
WINTER GARDEN MARKET UPDATE
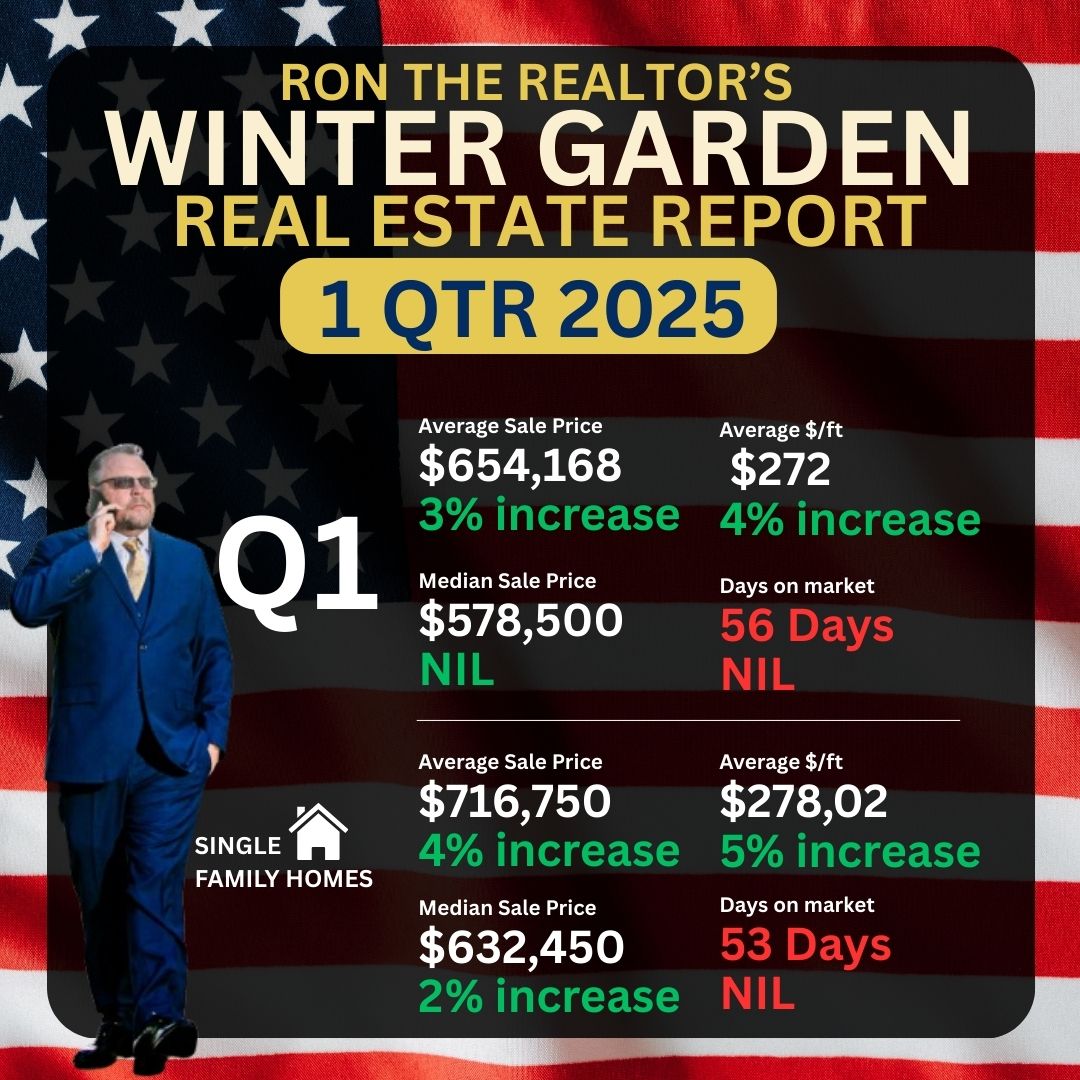
This is the only place on the web that breaks down the Winter Garden, Florida 34787 real estate market to this level of accuracy. Winter Garden is the 2nd fastest growing city in Central Florida, 1% behind Apopka. We are seeing an incredible volume of sales in the 2nd quarter and over 5% average price increase from the 1st quarter numbers !
For easy Reference, here is last quarters results:
| Status: Sold (281) | |||||||||||||
| Beds | Baths | SqFt Heated | List Price | LP/SqFt | Close Price | SP/SqFt | DTC | DTCL | ADOM | CDOM | SP/LP Ratio | ||
| Min | 1 | 1 | $42,500 | $37.47 | $42,000 | $35.80 | .67 | ||||||
| Max | 7 | 7 | 6,848 | $1,399,000 | $217.94 | $1,310,000 | $217.94 | 621 | 743 | 392 | 508 | 1.37 | |
| Avg | 4 | 3 | 2,487 | $288,082 | $113.31 | $280,577 | $110.39 | 83 | 124 | 72 | 79 | .97 | |
| Median | 4 | 3 | 2,386 | $284,900 | $111.16 | $274,296 | $109.64 | 56 | 104 | 51 | 55 | .98 | |
When you remove all multi family homes, this is what we end up with:
| Status: Sold (244) | |||||||||||||
| Beds | Baths | SqFt Heated | List Price | LP/SqFt | Close Price | SP/SqFt | DTC | DTCL | ADOM | CDOM | SP/LP Ratio | ||
| Min | 2 | 1 | $42,500 | $37.47 | $42,000 | $35.80 | .67 | ||||||
| Max | 7 | 7 | 6,848 | $1,399,000 | $217.94 | $1,310,000 | $217.94 | 621 | 743 | 392 | 508 | 1.37 | |
| Avg | 4 | 3 | 2,647 | $310,268 | $115.89 | $302,201 | $112.93 | 83 | 124 | 73 | 81 | .98 | |
| Median | 4 | 3 | 2,578 | $299,900 | $112.81 | $290,695 | $111.10 | 59 | 107 | 53 | 58 | .98 | |
Here are 2nd Quarters Read outs:
A massive surge in closed sales, 329 closed sales in JUST the 2nd Quarter !
| Status: Sold (329) | |||||||||||||
| Beds | Baths | SqFt Heated | List Price | LP/SqFt | Close Price | SP/SqFt | DTC | DTCL | ADOM | CDOM | SP/LP Ratio | ||
| Min | 1 | 1 | 616 | $23,000 | $24.15 | $23,000 | $24.64 | -88 | -4 | .66 | |||
| Max | 6 | 7 | 6,472 | $1,449,000 | $305.63 | $1,600,000 | $337.48 | 535 | 685 | 490 | 1,094 | 1.83 | |
| Avg | 4 | 3 | 2,443 | $294,626 | $119.31 | $287,972 | $116.55 | 71 | 116 | 66 | 78 | .98 | |
| Median | 4 | 3 | 2,268 | $275,000 | $120.37 | $270,954 | $116.49 | 44 | 90 | 42 | 46 | .98 | |
When you remove the multifamily the closed sales drops to still an impressive 275 single family homes sold in 3 months, this has to be a record.
| Status: Sold (275) | |||||||||||||
| Beds | Baths | SqFt Heated | List Price | LP/SqFt | Close Price | SP/SqFt | DTC | DTCL | ADOM | CDOM | SP/LP Ratio | ||
| Min | 2 | 1 | 616 | $23,000 | $24.15 | $23,000 | $24.64 | -88 | -4 | .66 | |||
| Max | 6 | 7 | 6,472 | $1,449,000 | $305.63 | $1,600,000 | $337.48 | 535 | 685 | 490 | 490 | 1.83 | |
| Avg | 4 | 3 | 2,636 | $320,887 | $121.44 | $314,049 | $118.91 | 74 | 120 | 69 | 80 | .98 | |
| Median | 4 | 3 | 2,544 | $299,900 | $121.66 | $290,000 | $118.76 | 49 | 94 | 47 | 52 | .98 | |
Not only a record but a nice uptick in pricing from 2014 averages on time of the high volume… an increase of $6 per foot is over 5% increase in property values. WOW! Also the average list price jumped over $12,000 !
WINDERMERE MARKET UPDATE
Where Ron calls home, no one is more in tune with the Windermere Market than Ron the Realtor. Windermere has been destroying the national averages on rate of appreciation and average sale price increases. Almost a 10% jump in average closed sales price from the 1st qtr to the 2nd qtr of 2015 !!!
Here are the results from 1st Quarter sales in Windermere , Fl 34786 for easy reference:
Total closed transactions…197:
| Status: Sold (197) | |||||||||||||
| Beds | Baths | SqFt Heated | List Price | LP/SqFt | Close Price | SP/SqFt | DTC | DTCL | ADOM | CDOM | SP/LP Ratio | ||
| Min | 2 | 2 | $127,200 | $87.50 | $143,325 | $82.14 | .76 | ||||||
| Max | 6 | 8 | 8,711 | $3,990,000 | $630.83 | $3,450,000 | $545.45 | 610 | 638 | 588 | 1,372 | 1.14 | |
| Avg | 4 | 4 | 3,172 | $625,406 | $176.17 | $592,472 | $167.99 | 105 | 144 | 102 | 121 | .96 | |
| Median | 4 | 3 | 3,004 | $399,900 | $143.51 | $389,661 | $140.04 | 67 | 115 | 71 | 91 | .97 | |
When we removed the multi family closed sales the numbers end up at:
| Status: Sold (163) | |||||||||||||
| Beds | Baths | SqFt Heated | List Price | LP/SqFt | Close Price | SP/SqFt | DTC | DTCL | ADOM | CDOM | SP/LP Ratio | ||
| Min | 3 | 2 | $209,500 | $87.50 | $206,000 | $82.14 | .76 | ||||||
| Max | 6 | 8 | 8,711 | $3,990,000 | $630.83 | $3,450,000 | $545.45 | 442 | 500 | 441 | 1,372 | 1.14 | |
| Avg | 4 | 4 | 3,507 | $713,343 | $185.67 | $674,589 | $176.44 | 111 | 151 | 109 | 131 | .96 | |
| Median | 4 | 4 | 3,288 | $463,990 | $152.11 | $450,000 | $148.47 | 84 | 124 | 90 | 107 | .97 | |
For the second Quarter of 2015, this is how Windermere, Florida ended:
| Status: Sold (232) | |||||||||||||
| Beds | Baths | SqFt Heated | List Price | LP/SqFt | Close Price | SP/SqFt | DTC | DTCL | ADOM | CDOM | SP/LP Ratio | ||
| Min | 2 | 1 | 1,013 | $145,000 | $90.05 | $145,000 | $90.63 | .5 | |||||
| Max | 9 | 11 | 21,515 | $16,500,000 | $766.91 | $8,250,000 | $491.89 | 719 | 779 | 718 | 718 | 1.09 | |
| Avg | 4 | 3 | 3,065 | $627,879 | $171.08 | $559,004 | $161.23 | 83 | 124 | 82 | 98 | .96 | |
| Median | 4 | 3 | 2,785 | $391,770 | $145.05 | $372,500 | $140.34 | 48 | 92 | 49 | 64 | .97 | |
When we remove the multifamily we end up at: 183 single family homes sold in 3 months !
| Status: Sold (183) | |||||||||||||
| Beds | Baths | SqFt Heated | List Price | LP/SqFt | Close Price | SP/SqFt | DTC | DTCL | ADOM | CDOM | SP/LP Ratio | ||
| Min | 2 | 1 | 1,013 | $215,000 | $90.05 | $211,000 | $90.63 | .5 | |||||
| Max | 9 | 11 | 21,515 | $16,500,000 | $766.91 | $8,250,000 | $491.89 | 719 | 779 | 718 | 718 | 1.08 | |
| Avg | 4 | 4 | 3,482 | $743,056 | $181.62 | $657,585 | $170.37 | 88 | 130 | 86 | 105 | .95 | |
| Median | 4 | 4 | 3,080 | $479,000 | $155.81 | $449,649 | $150.49 | 49 | 105 | 49 | 71 | .97 | |
In the second quarter it appears Windermere has kept up the blistering pace of appreciation from the first quarter with a $58,000 increase in average sales price ! That is almost an additional 10% in a quarter ! WOW !
RTR MARKET UPDATE
One of the most valuable sections of every edition and the one the competition goes to directly to read.
HUGE NEWS in the real estate world… TRID disclosure act has been postponed !! TILA-RESPA Integrated Disclosure (TRID) is a perfect example of big government screwing things up in the name of helping the little guy.
While the intentions are good in nature, like every Democrat spearheaded program this will be a disaster in the making. The rule is designed to ensure that all parties in a transaction have all the necessary paperwork for a closing 3 days prior to a closing. Sounds amazing on the surface.
The issue lies in that if even one thing is changed on the closing statement the 3 day time period is reset. This is where the disaster will develop. Many homeowners need to sell to buy, so what if your buyers buyer of their home has a not on the ball lender and they do not adhere to the 3 day advance delivery of closing docs… the entire chain of the deals is halted creating a traffic jam of massive proportions. The logistics of closing numerous deals side by side to transfer keys will be a thing of the past in all likelihood.
The funny thing is that the bureau of consumer affairs has been pounding their fists that this was going to be enacted on 8/1/15 hell or high water and every industry better be up to speed. One small issue, the language of the bill/ act was worded incorrectly so “for the betterment of the people” they are now delaying the launch of this disastrous TRID act.
Why would you want to enact such a massive restructuring of an entire industry during its peak month of the year is beyond me.
The fed has announced that there is a 50-50 chance interest rates will rise again in September.
CURRENT MARKET AT HAND
The market is currently red hot, those sellers that price their homes at market or even 1% below actual market value are seeing acceptable offers in days. Those with pools are receiving offers above appraisal value in many instances.
The sellers that are priced above market are seeing little to know activity/ offers. Today’s buyers have more information at their fingertips than ever in the history of real estate.
The difference maker now to selling your home is the Realtor you sign to represent your home sale.
It is also has never been more important for instant response from your Realtor, day or night. The 9-5 Monday thru Friday listing agent that takes weekends off is becoming the extinct animal.
In regards to buying a home, the market is moving so fast when you couple the pending interest rate increases on the horizon, summer high demand and constantly evolving technology of smart phones. The buyer that does not have an aggressive Realtor representing them will face many rounds of disappointment.
It is more crucial now than ever before to have a Realtor that eats and sleeps the local market.
The local market is seeing double digit appreciation and there has never been more new home choices than there is today for buyers. It is truly an exciting time in real estate for Central Florida.
Interest rates have risen over last 6 weeks, the days of under 4% rates are behind us, I am seeing 4.25 to 4.375% for “A” paper currently. This may recede a little with the developments in Greece but I believe this is the new floor for rates going forward. It was long overdue.
BRAGGING RIGHTS
Just crunched the numbers and the closed sales of homes in Orange County for last 10 years shows Ron the Realtor in the top 10 in the country.
RTTR SOLD an unheard of….
$172,688,210 in total sales volume on 822 closed sales from 2005-2015
This does not include the scores of New Home sales performed over the last 10 years.
Ron was just named to Orlando magazines Hot 100 in real estate for the 9th year in a row
Just awarded the Outstanding Professional Award , given to the top 1% in real estate in the country
Still proudly carrying the Best Real Estate Agent award from SW Bulletin Reader poll for 2015.
Have a safe 4th of July everyone and God Bless our troops overseas and the families they leave behind. Freedom is never FREE.
The best compliment I can receive is a referral of your friends and family when it is time for them to buy or sell..
With my newsletter going from monthly to quarterly….