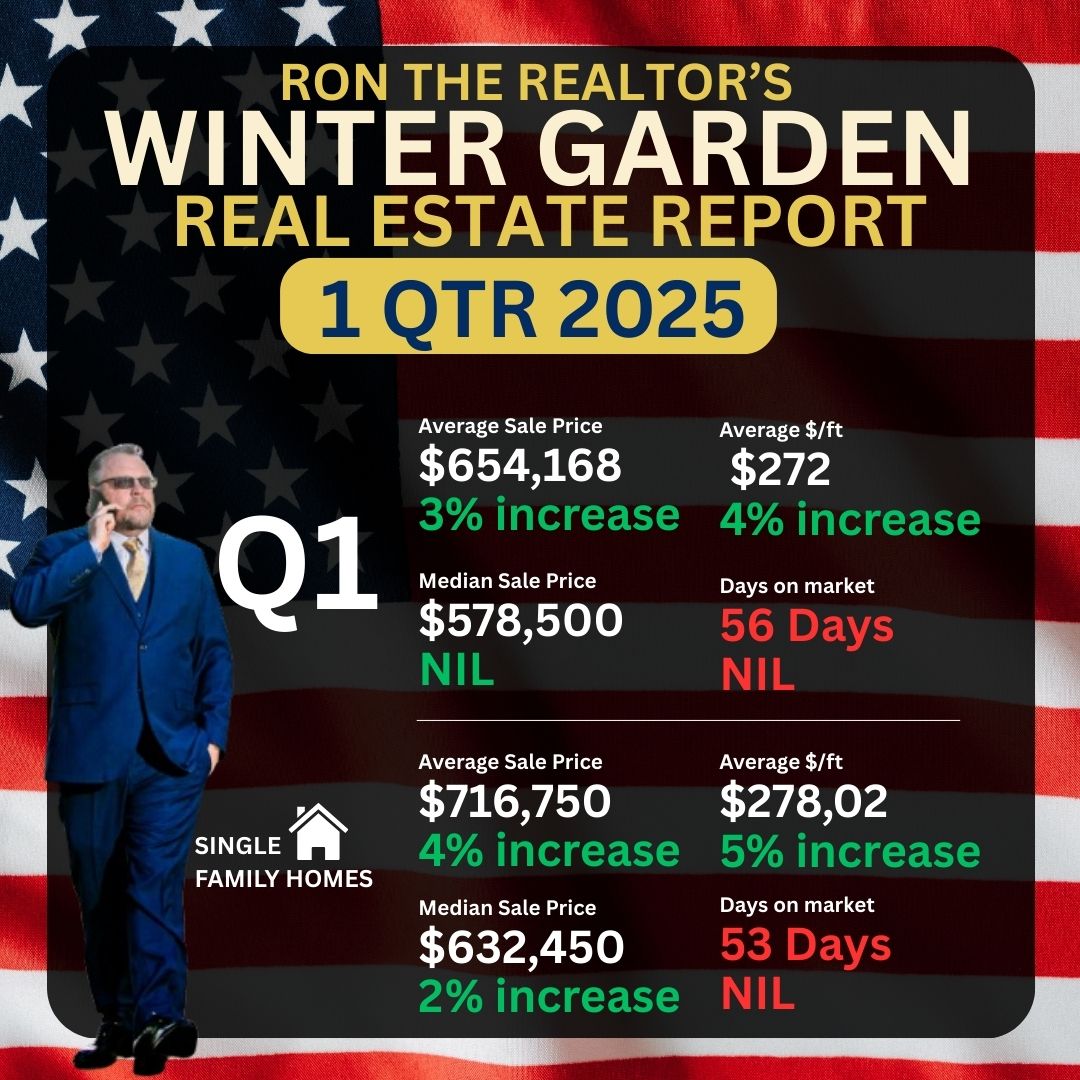
1st Quarter 2019 Summary
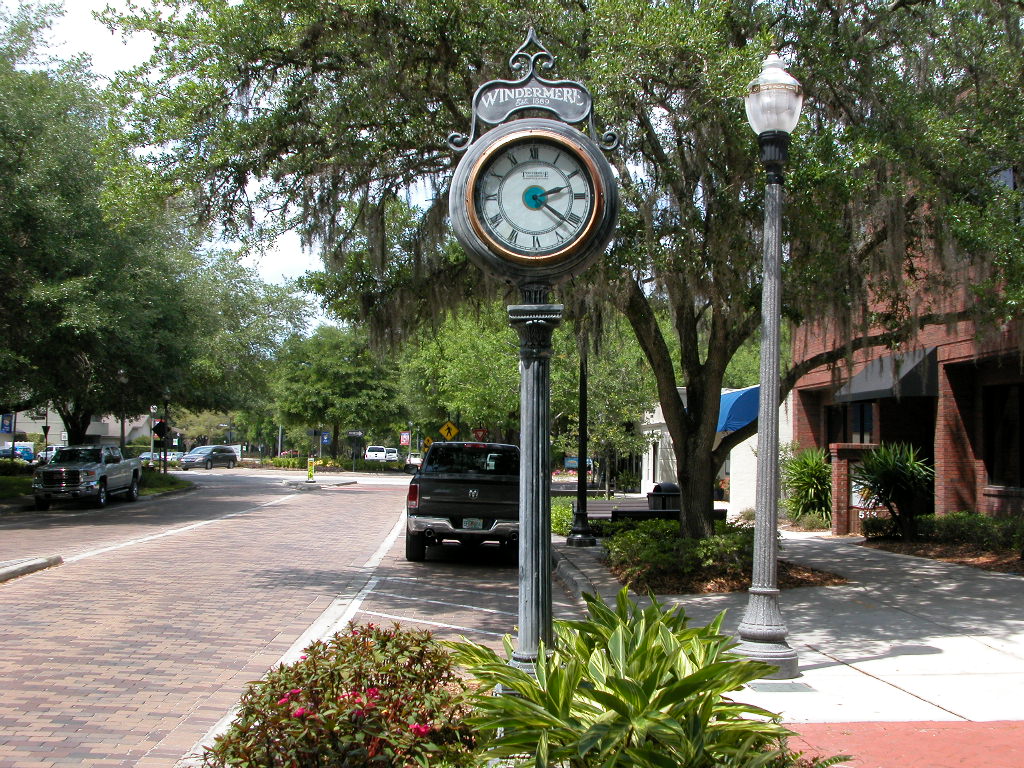
Windermere Market Report
Welcome to the only place on the web that breaks down Windermere Florida 34786 real estate market to this level each and every quarter for well over the past decade. All the data here is derived from the ORRA MLS and deemed reliable. It has been analyzed by longtime Windermere resident Ron the Realtor. Ron is the #1 Remax Realtor in the entire State of Florida for the second year in a row and is currently number 3 in closed volume year to date for Orange County in the entire MLS.
610,769
2
74
17
180.62
1
Here is a side by side comparison of the 2019 1st Quarter and all of 2018 in Windermere
1st quarter 2019 units sold in Windermere 34786
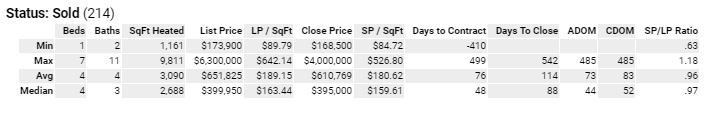
All of 2018 units sold in Windermere 34786
The was minimal change in the Windermere market when you compare it to the entire 2018 calendar year, this is very typical. The 1st quarter of the year will be mostly comprised of homes that staggered through the holiday season and have been scooped up at discounted prices. The only significant change was the median sale price coiled back 3% in the 1st quarter, also indicative of the lower sin the 1st quarter compared to 2nd and 3rd quarter sales (which heavily weigh the entire calendar year numbers)
Let's track apples to apples and examine the 1st quarter of 2019 compared to the 1st quarter of 2018.
2019 1st Quarter vs 2018 1st Quarter
2019 1st Quarter Windermere 34786
1st Qtr 2018 Windermere 34786
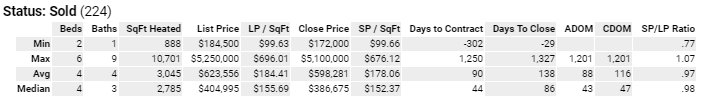
2
17
1
When we compare year over year first quarter we see a nice uptick in all four major market indicators. What really sticks out is the 17% increase in days on market improvement. This signifies a 2 week faster sale pace than just a year prior. This could be the largest improvement I have ever seen in a calendar year in Windermere. This definitely shows strong demand for the area.
Please keep in mind while 2% does not seem too significant and is actually below the 3% of the entire local Orlando market improvement from 2018 to 2019… this 2% represents a $12,000 increase, coupled with a 2 week faster close, sellers are experiencing higher sales in faster time, lowering their carrying costs !
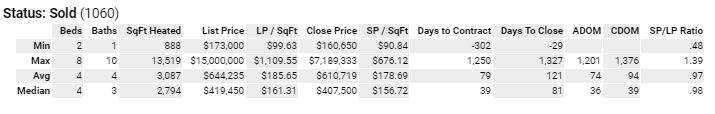
2018 1st Quarter vs 2019 1st Quarter
Single Family Homes
All of 2018 Windermere Single Family Homes
2019 1st Qtr Single Family Homes
701,980
84
186.20
No significant change when comparing the 2019 1st quarter to the entire 2018 calendar year.
Lets compare apples now…1st quarter 2018 to 2019 Windermere Single Family housing market
1st quarter 2018 vs 2019 Windermere Single Family housing market
Single Family Homes
2018 1st Qtr Single Family
2019 1st Qtr Single Family Homes
4
16
1
When one breaks the Windermere single-family market away from the multifamily, you really see the true picture. This is why Ron the Realtor is always ahead of the curve. Data is only useful if you know how to apply it to real world practice. Street smarts and common sense really improve this vision.
The Windermere housing market is ON FIRE…. 4% increase in average sale price signifies $28,000 jump on average… and a 17-day improvement in days on market!
Windermere is in high demand. Any avid reader of this quarterly blog know the reasons. They are constantly stated and the reason Ron and his family have called Windermere home for the last 14 years. So let’s just get to the all important RTR market predictions, I need to get back to selling some homes ….
MARKET PREDICTIONS
Welcome to the section most just skip too…lol
Following true to the 2018 year in review forecast released 3 months ago… we are following the exact track RTR predicted out of the gate. The 2nd and 3rd quarter will drive the needle on all major categories when comparing to 2018 entire calendar year. When we break it down quarter versus quarter we will continue to outpace the local market in year to year comparison.
***By the end of the year, as predicted in the 2018 year in review forecast… a 3% jump in average rice, a 5-6% jump in median sale price (many higher priced homes will sell in 2019 with rates being so low and the economy booming). $/ft will rise but only slightly and days on the market while im record numbers when analyzing quarter to quarter breakdowns… will improve by most likely a week over the course of the calendar year (this is still amazing btw)
"Thank you for taking the time out of your day to gain some insight on the local Windermere market that my family personally calls home. I am so blessed to have helped so many families spanning over 2 decades in the area. Earning the #1 Remax Realtor in the entire State of Florida a second year in a row, 18th in the ENTIRE COUNTRY, voted the Best of Southwest Realtor for the 4th time in a row and named to the Orlando Magazines HOT 100 for the 13th year in a row.
I just want to thank everyone in the RTR army for allowing me the honor to represent and fight for your family. Thanks to your confidence in my abilities I am able to be one of the very few that can say I love what I do every day.
God Bless our troops overseas and the families they leave behind. I will never forget that FREEDOM IS NEVER FREE. My family thanks you for your sacrifice."
THE HARDER YOU WORK, THE LUCKIER YOU GET